
Ofsted and Performance Data
Primary Schools are not required to publish any new exam and assessment results for 2021-2022, as the DFE will not be publishing any performance measures for KS2 this year. Data for 2018-2019 can be seen below for KS2.
Phonics Data for Y1 and Y2 2021-2022
Year 4 Multiplication Times Tables Check 2022
(28 children in the cohort – 26 children took the test with 2 children unable to access the test due to working below expectation)
Percentage of pupils who achieved 25/25 marks:
12/26 – 46%
(Cohort 28 – 12/28 – 43%)
Percentage of pupils who achieved 21/25 marks or more:
21/26 – 81%
(Cohort 28 – 21/28 – 75%)
Mean score for cohort:
Children who took the test (26) mean score – 23
Cohort 28 – mean score 21
Achievement Summary 2018-2019
|
SNAPE WOOD - KEY STAGE 2 DATA (VALIDATED) |
Key Stage 2 results include adjustment as 3 pupils who arrived in the UK less than 2 years before the end of Year 6 are not included in the school’s validated data.
Key Stage 2 Results
Expected Standard
|
|
Reading |
Writing |
Grammar |
Maths |
|||||||
|
|
School |
National |
School |
National |
School |
National |
School |
National |
|||
|
EXS 2016 |
35% |
66% |
57% |
74% |
78% |
72% |
78% |
70% |
|||
|
Gap |
-31% |
-17% |
+0.6% |
+0.8% |
|||||||
|
EXS 2017 |
61% |
71% |
64% |
76% |
71% |
77% |
61% |
75% |
|||
|
Gap |
-10% |
-12% |
-0.6% |
-14% |
|||||||
|
EXS 2018 |
68% |
75% |
61% |
78% |
71% |
78% |
68% |
76% |
|||
|
Gap |
-7% |
-17% |
-7% |
-8% |
|||||||
|
EXS 2019 |
60% |
73% |
60% |
78% |
64% |
78% |
68% |
79% |
|||
|
Gap |
-13% |
-18% |
-14% |
-11% |
|||||||
High Score
|
|
Reading |
Writing |
Grammar |
Maths |
|||||||
|
|
School |
National |
School |
National |
School |
National |
School |
National |
|||
|
High 2016 |
0% |
19% |
0% |
15% |
9% |
22% |
9% |
17% |
|||
|
Gap |
-19% |
-15% |
-13% |
-8% |
|||||||
|
High 2017 |
7% |
25%
|
7% |
18%
|
29% |
31%
|
11% |
23%
|
|||
|
Gap |
-18% |
-11% |
-2% |
-12% |
|||||||
|
High 2018 |
14% |
28% |
11% |
20% |
39% |
34% |
18% |
24% |
|||
|
Gap |
-14% |
-9% |
+5% |
-6% |
|||||||
|
High 2019 |
8% |
27% |
12% |
20% |
28% |
36% |
32% |
27% |
|||
|
Gap |
-19% |
-8% |
-8% |
+5% |
|||||||
Reading, Writing and Maths Combined KS2
|
|
Expected or Above |
High |
|
School 2016 |
22% |
0% |
|
National 2016 |
53% |
5% |
|
Gap 2016 |
-31% |
-5% |
|
School 2017 |
43% |
0% |
|
National 2017 |
61% |
9% |
|
Gap 2017 |
18% |
-9% |
|
School 2018 |
54% |
0% |
|
National 2018 |
64% |
10% |
|
Gap |
-10% |
-10% |
|
School 2019 |
56% |
8% |
|
National 2019 |
65% |
11% |
|
Gap |
-11% |
-3% |
Average Scaled Score KS2
|
|
Reading |
Grammar |
Mathematics |
|
National 2016
|
103 |
104 |
103 |
|
School 2016
|
98.2 |
104 |
105 |
|
National 2017
|
104 |
106 |
104 |
|
School 2017
|
99.7 |
105 |
101 |
|
Gap |
-4.3 |
-1.0 |
-3.0 |
|
School 2018 |
101 |
105 |
102 |
|
National 2018 |
105 |
106 |
104 |
|
Gap |
-4% |
-1% |
-2% |
|
School 2019 |
100.93 |
102.7 |
102.70 |
|
National 2019 |
104.54 |
106.3 |
104.55 |
|
Gap |
-3.61 |
-3.6 |
-1.85 |
Key Stage 1 Results
Expected Standard
|
|
Reading |
Writing |
Maths |
|||||
|
|
School |
National |
School |
National |
School |
National |
||
|
EXS 2016 |
57% |
74% |
60% |
65% |
63% |
73% |
||
|
Gap |
-17% |
-5% |
-20% |
|||||
|
EXS 2017 |
68% |
74%
|
67% |
69%
|
63% |
75%
|
||
|
Gap |
-6% |
-2% |
-12% |
|||||
|
EXS 2018 |
57% |
75% |
53% |
70% |
67% |
70% |
||
|
Gap |
-18% |
-13% |
-3% |
|||||
|
EXS 2019 |
55% |
75% |
52% |
69% |
62% |
76% |
||
|
Gap |
-20% |
-17% |
-14% |
|||||
Greater Depth
|
|
Reading |
Writing |
Maths |
|||||
|
|
School |
National |
School |
National |
School |
National |
||
|
GDS 2016 |
3% |
24% |
0% |
13% |
3% |
18% |
||
|
Gap |
-21% |
-13% |
-15% |
|||||
|
GDS 2017 |
8% |
25%
|
0% |
16%
|
8% |
21%
|
||
|
Gap |
-17% |
-16% |
-13% |
|||||
|
GDS 2018 |
7% |
26% |
7% |
16% |
7% |
22% |
||
|
Gap |
-19% |
-9% |
-15% |
|||||
|
GDS 2019 |
7% |
25% |
7% |
15% |
7% |
22% |
||
|
Gap |
-18% |
-8% |
-15% |
|||||
|
Reading, Writing and Maths Combined KS1 |
Expected or Above |
High |
|
School 2016 |
46% |
0% |
|
National 2016 |
60% |
9% |
|
Gap 2016 |
-14% |
-9% |
|
School 2017 |
58% |
0% |
|
National 2017 |
64% |
11% |
|
Gap 2017 |
-6% |
-11% |
|
School 2018 |
47% |
7% |
|
National 2018 |
65% |
12% |
|
Gap |
-18% |
-5% |
|
School 2019 |
52% |
7% |
|
National 2019 |
65% |
11% |
|
Gap |
-13% |
-4% |
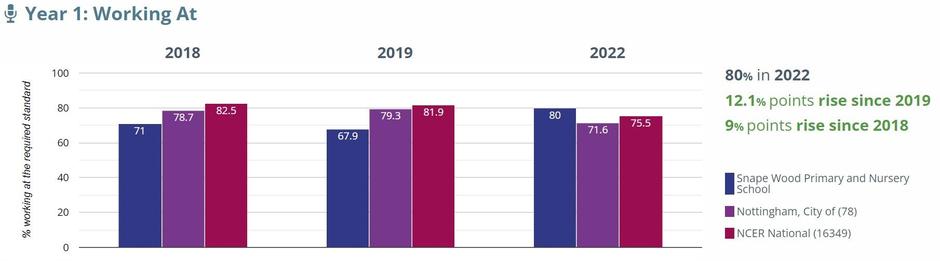
Year 1 Phonics Screening Check
|
|
% at expected level 2015 |
% at expected level 2016 |
% at expected level 2017 |
% at expected level 2018 (32) |
% at expected level 2019 () |
|
School |
50% |
63% |
70% |
71% |
68% |
|
National |
77% |
81% |
81%
|
83% |
82% |
|
Gap |
-27% |
-18% |
-11% |
-12% |
-14% |
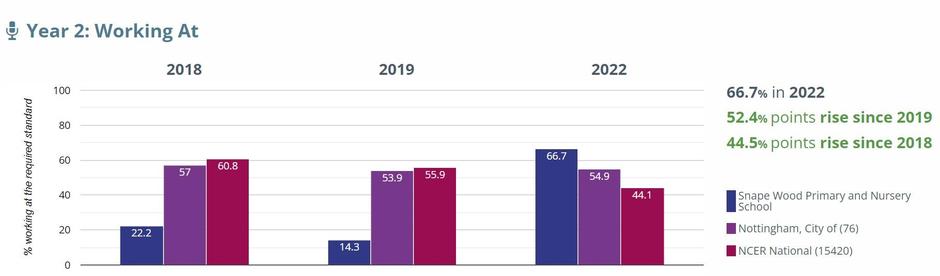
Year 2 Phonics Screening Check
|
|
% at expected level 2015 |
% at expected level 2016 |
% at expected level 2017 |
% at expected level 2018 () |
% at expected level 2019 () |
|
School |
13% |
53% |
44% |
22% |
14% |
|
National |
- |
- |
67% |
61% |
56% |
|
Gap |
- |
- |
-23% |
-39% |
-42% |
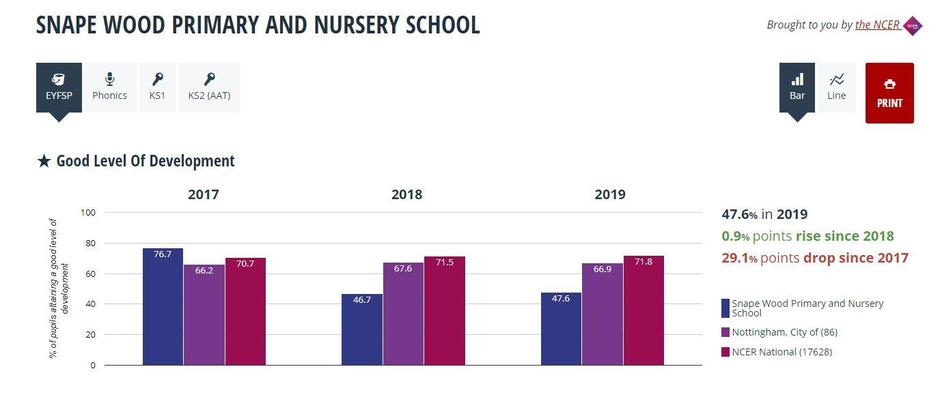
EYFS Year on Year Data
|
|
GLD 2015 |
GLD 2016 |
GLD 2017 |
GLD 2018 |
GLD 2019 |
|
School |
42% |
62% |
77% |
47% |
48% |
|
National |
66% |
69% |
71%
|
72% |
72% |
|
Gap |
-23% |
-7% |
-6% |
-25% |
-24% |
|
LA |
58% |
64% |
66% |
68% |
67% |
|
Gap |
-16 |
-2 |
-11% |
-21% |
-19% |
DIMINISHING THE DIFFERENCE
END OF EYFS RESULTS 2019
|
SUBJECT |
ALL PUPILS 2016 |
DIS 2016 |
ALL PUPILS 2017 |
DIS 2017 |
ALL PUPILS 2018 |
DIS 2018 |
ALL PUPILS 2019 |
DIS 2019 |
|
GLD |
58% |
70% |
71% |
83% |
47% |
30% |
48% |
25% |
END OF KS1 RESULTS 2019
|
SUBJECT |
ALL PUPILS 2016 |
DIS 2016 |
ALL PUPILS 2017 |
DIS 2017 |
ALL PUPILS 2018 |
DIS 2018 |
ALL PUPILS 2019 |
DIS 2019 |
|
READING |
64% |
53% |
71% |
65% |
57% |
60% |
55% |
40% |
|
WRITING |
64% |
58% |
71% |
65% |
53% |
40% |
52% |
40% |
|
MATHS |
64% |
64% |
71% |
59% |
67% |
60% |
62% |
53% |
|
RWM COMBINED |
55% |
42% |
71% |
53% |
47% |
40% |
52% |
40% |
END OF KS2 RESULTS 2019
|
SUBJECT |
ALL PUPILS 2016 |
DIS 2016 |
ALL PUPILS 2017 |
DIS 2017 |
ALL PUPILS 2018 |
DIS 2018 |
ALL PUPILS 2019 |
DIS 2019 |
|
READING |
50% |
32% |
40% |
65% |
68% |
68% |
54% |
50% |
|
WRITING |
75% |
53% |
40% |
70% |
61% |
59% |
54% |
50% |
|
MATHS |
50% |
84% |
40% |
65% |
68% |
64% |
64% |
61% |
|
RWM COMBINED |
21% |
25% |
40% |
44% |
54% |
50% |
50% |
44% |
PHONICS
|
SUBJECT |
ALL PUPILS 2016 |
DIS 2016 |
ALL PUPILS 2017 |
DIS 2017 |
ALL PUPILS 2018 |
DIS 2018 |
ALL PUPILS 2019 |
DIS 2019 |
|
YEAR 1 |
25% |
30% |
27% |
32% |
71% |
60% |
68% |
75% |
|
YEAR 2 |
40% |
60% |
0% |
57% |
23% |
6% |
14% |
N/A |
Snape-Wood-Primary-achievement-summary-2018-2019
EYFS DATA 2018-2019
EYFS, KS1 and KS2 2017 Achievement Summary
Results for KS2 Tests 2016
|
Year 6 - Tests 2016 |
Average Progress |
Average Progress (LA) |
Average Progress (National) |
|
Reading (Average and in line with National) |
0 (-2.6 to +2.6) |
0 |
0
|
|
Writing (Average and in line with National) |
+0.1 (-2.5 to +2.7) |
+0.4 |
0 |
|
Maths (Above National 10% of schools in England) |
+2.9 (+0.7 to +5.1) |
+0.7 |
0 |
Average Progress score in RWM Disadvantaged and Non-Disadvantaged
|
Year 6 - Tests 2016 |
All Pupils |
Disadvantaged (School) |
Disadvantaged (National) |
|
Reading |
-1.7 |
0.3 |
-0.7
|
|
Writing |
1.5 |
-0.2 |
-0.3 |
|
Maths |
2.4 |
+3 |
-0.5 |
Percentage of pupils meeting the expected standard in reading, writing and maths (Attainment)
|
Year 6 - Tests 2016 |
Expected (School) |
Expected (LA) |
Expected (National) |
|
Reading, Writing and Maths |
22% (Below LA and National) |
50% |
53%
|
Please find below our most recent Ofsted reports and relevant information from the Department for Education Performance Tables.
-
Department for Education
Performance data and KS2 results.
-
Ofsted - Government website
Links to our school's page.